Summary
In this lecture, we will cover the following:
- How to compute deflected nodal positions from the displacement vector,
- How to plot the deflected shape with a heat-map overlay,
- How to set up a colour scale that adapts to all-positive, all-negative, or mixed displacement values,
- How to wire up
ipywidgetsso we can interactively toggle the deflected shape, change the scale, and pick which displacement component to view.
This lecture is where everything we have built so far really comes to life on screen. We start by bringing in ipywidgets as a new dependency. We then build a more substantial plot_deflection function driven by user inputs defined using widgets.
Next up
In the next lecture, we will polish the visualisation further by adding arrows that mark the location of the maximum displacement for whichever component we are viewing, building directly on the plotting and widget patterns we have just established.
Tags
deflected shapeheat-map visualisationipywidgetscolour scale
Please log in or enroll to continue
If you've already enrolled, please log in to continue.
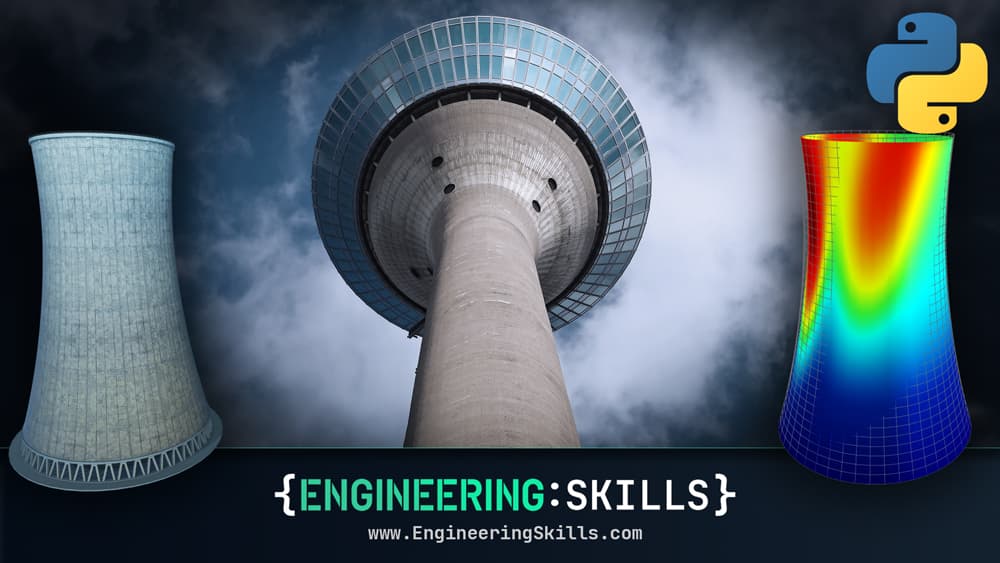
Finite Element Analysis of Plate and Shell Structures: Part 2 - Shells
Expanding from plate to shell elements - build a workflow that unlocks the behaviour of 3D shell structures
After completing this course...
- You will understand how we make the leap from Reissner-Mindlin plate elements to shell elements and what extra modelling fidelity that provides.
- You will be comfortable using a combination of GMSH and the open-source 3D modelling software, Blender, to generate custom finite element meshes.
- You will be able to use OpenSeesPy to model shell structures, as an alternative to your own custom finite element solver.
- You will have a much greater understanding of what commercial finite element packages are doing, behind the UI, allowing you to authoritatively interrogate their results.