Getting Started with Graphic Statics
![[object Object]](/_next/image?url=%2Fimages%2Fauthors%2Fedmond_saliklis.jpg&w=256&q=75)
Hello and welcome to an exciting journey into the world of graphical structural analysis or graphic statics. New ideas will open up before your eyes with this tutorial, and although the initial diagrams may appear overly complicated, you will soon see that they are not only simple to construct, but they contain an incredible secret!
Herein, I want to give you an introduction to what graphic statics is and to explain why I'm so passionate about it. I intend to utterly change your perception of structural form and structural forces!
You will become a convert, like I became, once I saw the beauty and the power of this technique.
1.0 A brief history of graphic statics
The heyday of graphic statics was really in the 1920s and the 1930s. A great starting point, it you're new to the subject is the fantastic book, Graphical Analysis by William S. Wolfe - written in 1921.
Fig. 1. Graphical Analysis by William S. Wolfe (1921).
By 1934, there were papers published in the Journal of American Society of Civil Engineers, for example "Stresses in spatial structures" on 3 dimensional graphic statics.
Fig. 2. Stresses in Spatial Structures (1934).
However, the study of graphic statics goes back further in history. A key figure was Pierre Varignon, who, in the eighteenth century, started writing about the topic and publishing beautiful drawings.
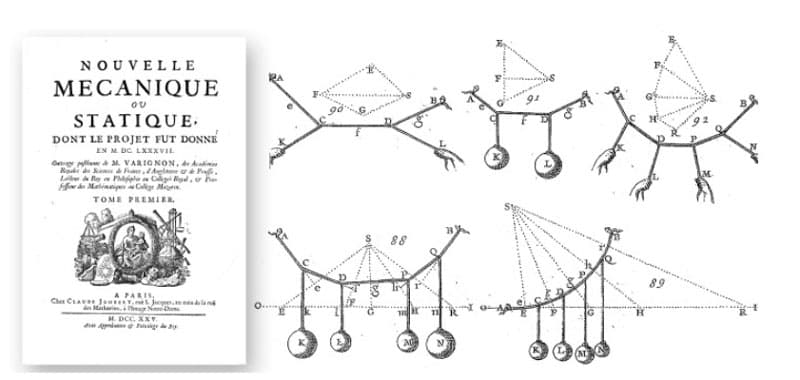
Fig 3. Nouvelle Mecanique ou Statique by Pierre Varignon with depictions of funicular forms.
The loaded cable/rope shapes depicted by Varignon (Fig 3 above) are very intuitive and simply feel "correct" to us. The reason they "feel" correct is because we see these again and again in real life, these shapes are called funiculars.
The word funicular refers to the shape that a hanging chain would take under any load. A specific funicular that you might have heard of is a catenary, but that is a chain subjected to only its self weight.
In these figure we see point loads. Those hands pulling on the chain are imposing point loads and since we are neglecting the weight of the chain itself, the chain forms straight lines between the points of load application.
The beautifully drawn spheres represent point loads acting downwards in the direction of gravity. Hopefully the resulting shapes are intuitively correct to you.
Even though the peak of graphic statics was in the 1920s and 1930s, by the 1960s it was essentially gone. Why it disappeared is a longer story, but the synopsis is that we academic professors fell in love with matrix methods and the very sophisticated theories of structural analysis and structural mechanics that continued to flourish mathematically.
Then, the somewhat brutish theory of matrix methods found widespread applications through the availability of the computer, in the 1960s 1970s and 1980s. That really drove graphic statics down essentially to the grave, coupled with the fact that engineers drew less and less by hand.
But then something miraculous happened. Ed Allen and Vaclav Zalewski were the people that promoted the rebirth of graphic statics. Together, they wrote two books. The first was "Shaping Structures", and the second was "Form and Forces". This second one is a great book. It affected a lot of people, who took the topic much, much further than Allen and Zalewski did.
Fig 4. Form and Forces: Designing Efficient Expressive Structures by Allen Zalewski.
However, that book is not a book to learn graphic statics. It's a great book to see how to use graphic statics, but to actually learn how to do graphic statics I would recommend my recently published book, Structures: A Geometric Approach.
Fig 5. Structures: A Geometric Approach by Edmond Saliklis.
Let's also mention some of my heroes in the world of graphic statics. Professor John Ochsendorf was a mentee of Ed Allen, and he was deeply affected by Ed Allen's pedagogy. Ochsendorf then mentored Phillipe Block who is a brilliant engineer at ETH Zurich, one of the leading masters of geometric methods. Block's PhD student, Masoud Akbarzadeh, who is now at Penn does amazing 3 dimensional graphic statics.

Fig 6. John Ochsendorf (left), Phillipe Block (center), Masoud Akbarzadeh (right).
In this tutorial, we are not going to do any 3 dimensional graphic static. We're just going to stay within a limited palette to understand the material. At first, we are not even going to use the computer. Even if you're a Rhino/Grasshopper guru, please simply use a pencil and paper - in this first tutorial I want you to really understand how to do this with the pencil.
Engineering tutorials,
written by an engineer — not a model.
Read the rest, download the resources and unlock the full archive. This is independent, human-crafted engineering content. An Essentials Membership gets you access to all member-only tutorials and helps keep the lights on for a learning platform built by engineers, for engineers.
Essentials Membership
- Instant access to the full archive
- 28-day refund, no questions
- Cancel anytime
- Your card and subscription are handled by Stripe
Already a member? Log in
Featured Tutorials and Guides
If you found this tutorial helpful, you might enjoy some of these other tutorials.
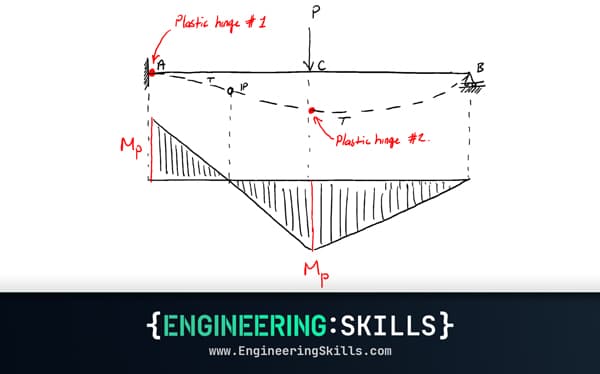
Yielding, Plastic Deformation and Moment Redistribution in Beams (2/2)
Learn how calculate plastic moment capacities and how moment redistribution occurs in a structure

Dr Seán Carroll
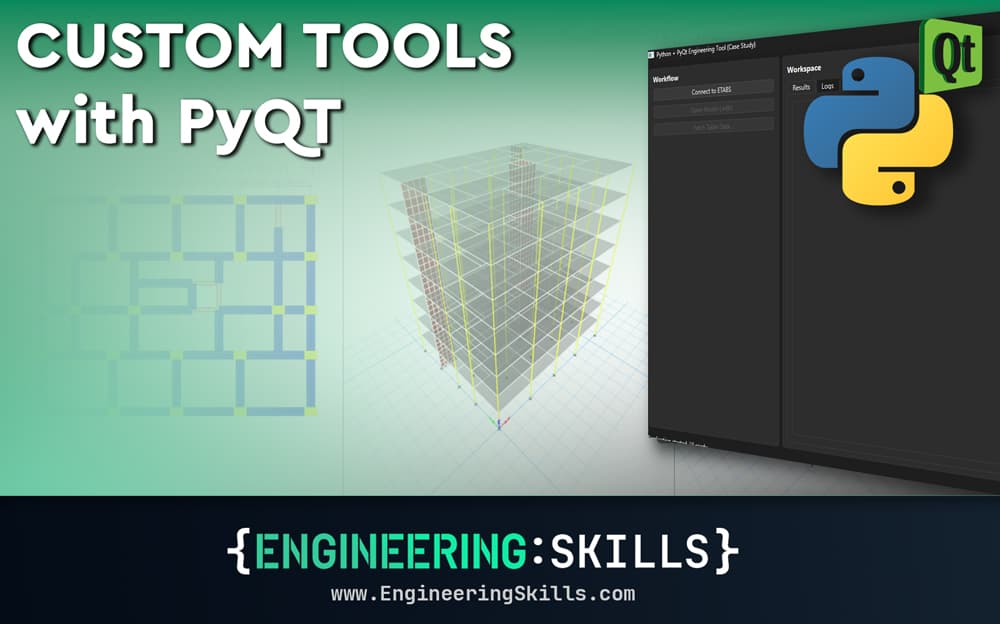
Building Custom Engineering Tools in Python with PyQt
A step-by-step guide to designing workflow-first engineering tools that interface with your FE software

Hakan Keskin
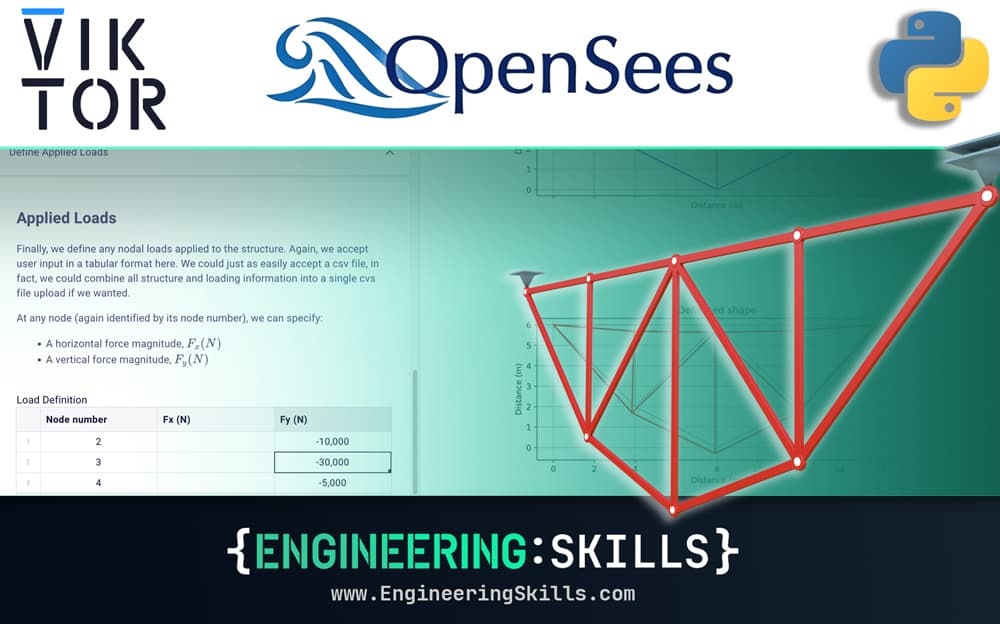
Using VIKTOR to Build a Shareable Truss Calculator App - Project Overview
Build a user-friendly analysis web app powered by OpenSeesPy and VIKTOR
Dr Seán Carroll