Free Truss Calculator – Quick Start Guide
![[object Object]](/_next/image?url=%2Fimages%2Fauthors%2Fsean_carroll.png&w=256&q=75)
This is a quick start guide for our free online truss calculator. Follow this short text tutorial or watch the Getting Started video below. We’ll walk through the process of analysing a simple truss structure. By the end, you’ll be comfortable using the truss calculator to quickly analyse your own truss structures. To go directly to the free truss calculator app, follow the link below.
🧰 Go to the Free Truss Calculator
🛠 We now also have a free 3D truss calculator – check that out here.
Step 1 – Defining the structure
Nodes
The very first task in any analysis is to number the nodes in our structure and define a coordinate system origin. This can be at any point in the plane. The positions of each node are then measured with reference to this origin point. For the truss structure we’re analysing, Fig 1, we’ve chosen an origin located outside the structure. So for example, node 1 has coordinates [0,6] while node 7 has coordinates [8,0]. The actual location of the origin is arbitrary.
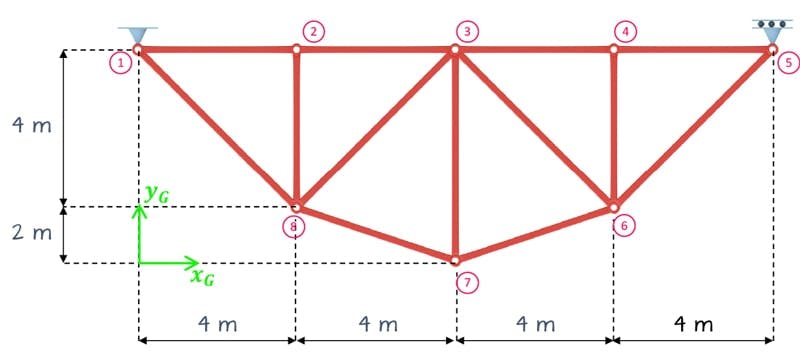
Fig 1. Structure with numbered nodes and an arbitrary origin location identified.
With an origin defined and all nodes numbered, we can input this into the relevant data entry box, Fig 2. Each node is defined on a new line. Be careful not to leave a comma and the end of a line and also be careful not the press return (generating a new empty line) after you’ve defined your last node. Both will trigger a data input error that must be corrected before submission.
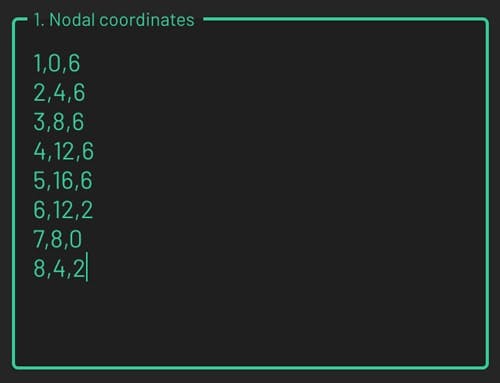
Fig 2. Node definitions; each row indicates, node number, x-coordinate and y-coordinate.
While you can type directly into the node definition data entry box, you may find it easier to define your nodes in a spreadsheet and then copy and paste this data directly into the data entry box, Fig 3. This is generally quicker and avoids the trailing comma and new line errors discussed above. Clicking on the ‘Example Data’ button under the 3D window will open a Google sheet with this structure fully defined. You can copy and paste that data directly if you prefer.
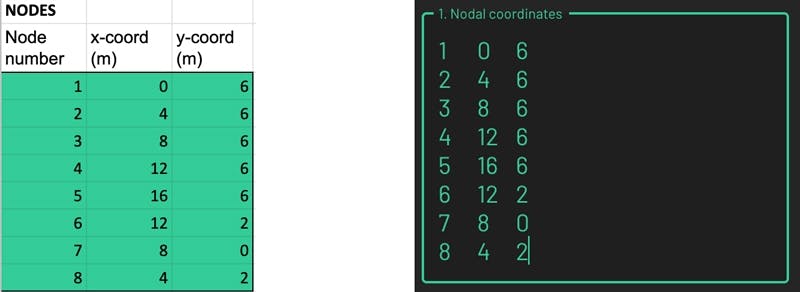
Fig 3. Nodes defined in a spreadsheet (left) and copy-pasted into the nodes data entry window (right).
As each node is defined it will appear in the 3D view window, Fig 4.
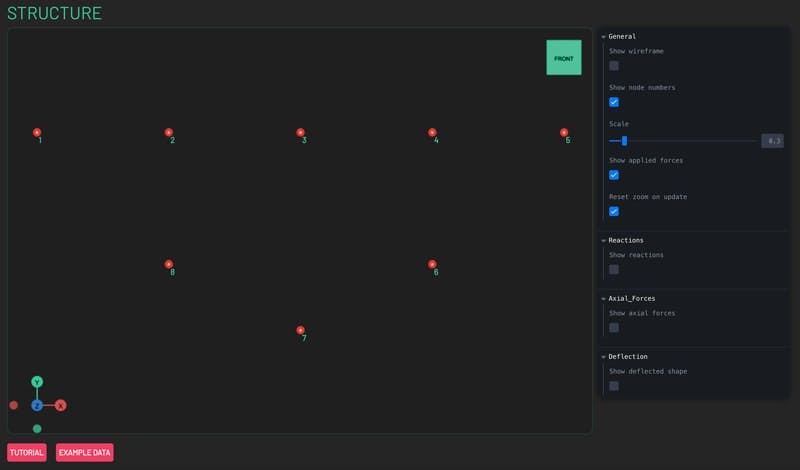
Fig 4. Numbered nodes are visible in the 3D view window after they are defined.
Members
Members definitions follow the same principles as node definitions. Each member is defined on a new line with a complete member definition consisting of:
- Member number
- Node number at end i
- Node number at end j
- Material (Young’s) modulus
- Cross-sectional area
- Yield stress
- Self-weight
You can manually type the data, row by row or copy and paste directly from a spreadsheet, Fig 5. Copying from a spreadsheet is particularly advantageous here as there is repeated data in each row. A sample set of data for the structure in Fig 1. can be copied from the same spreadsheet we referenced above. As each new member is defined, it will appear in the 3D view, Fig 6.
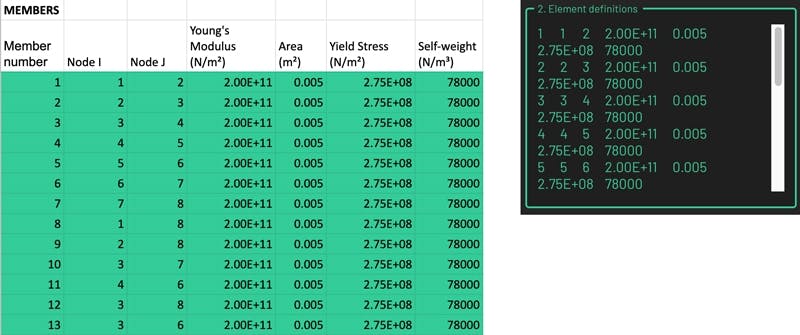
Fig 5. Members defined in a spreadsheet (left) and copy-pasted into the members data entry window (right).
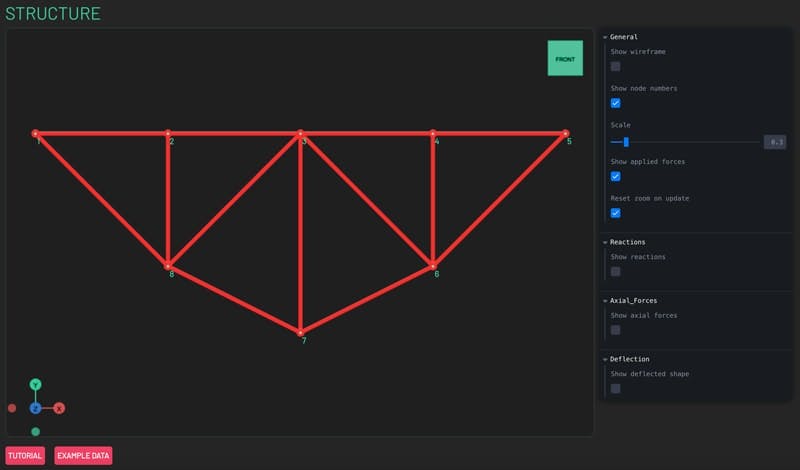
Fig 6. Members are visible in the 3D view window after they are defined.
Step 2 – Defining supports/restraints
Restraints are defined by specifying the node number followed by ‘true’ or ‘false’ to indicate if the node is restrained in the horizontal direction and ‘true’ or ‘false’ to indicate restraint in the vertical direction. In our case, we have a pin at node 1 and a horizontal roller at node 5. These restraints are defined as indicated in Fig 7. Restraints are visible in the 3D view once defined.
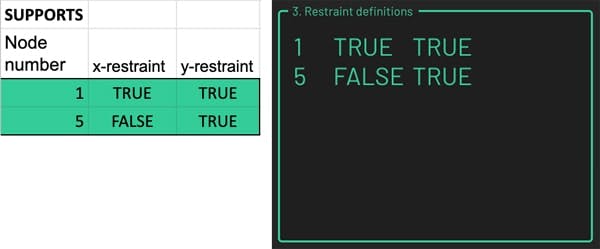
Fig 7. Horizontal and vertical restraint of node 1 (pin) and vertical restraint only of node 5 (horizontal roller).
Step 3 – Defining applied loads
Applied nodal loads are specified by indicating the node number, the horizontal force component and the vertical force component. The loading for each node should be defined in a single row. Arrows indicating the applied loads are visible in the 3D view. Our structure will resist 3 vertical point loads of magnitude 10kN, 30kN and 5kN, all pointing downwards, at nodes 2, 3 and 4 respectively, Fig 8. The direction is indicated by a negative sign. Similarly, horizontal forces to the right are positive and to the left are negative.
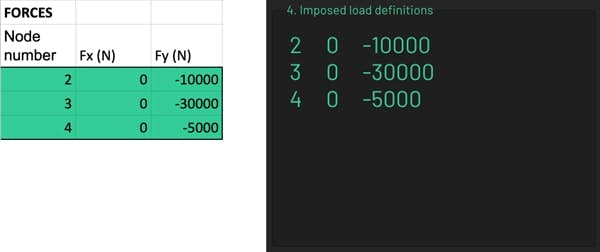
Fig 8. Applied forces defined in a spreadsheet (left) and copy-pasted into the loading data entry window (right).
The final structure, restraint conditions and applied loading can be reviewed in the 3D view, Fig 9. Once you are satisfied, press the ‘Solve’ button in the bottom right corner of the data input block. This will submit your analysis request.
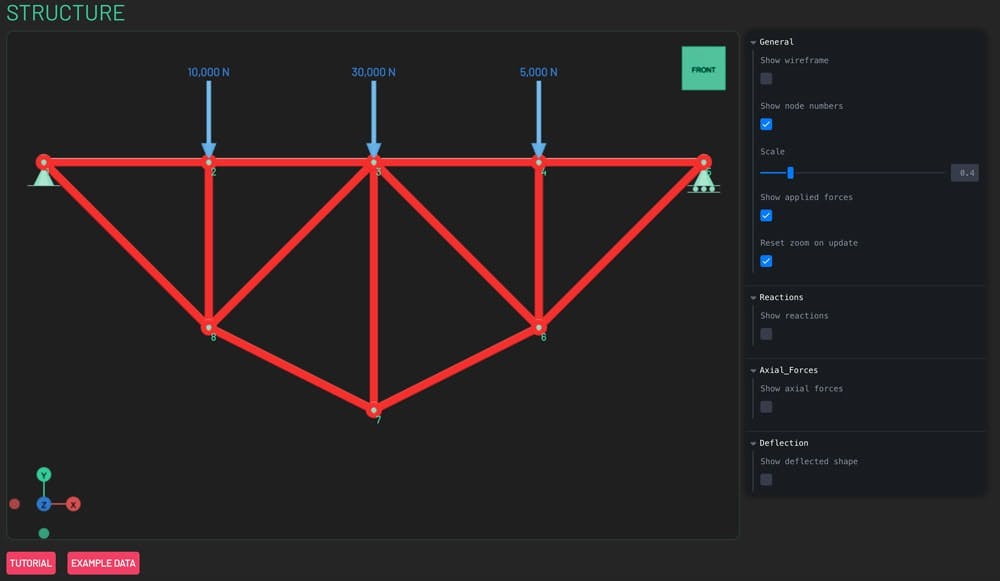
Fig 9. Structure, restraints and loading, fully defined and ready to be solved.
Reviewing the truss calculator results
Analysis report
Once you have submitted your analysis and results have been calculated and returned, a number of new panels will become visible below the (now collapsed) data entry panel. The data entry panel can be expanded and input data edited by clicking the pink arrow icon to the right of the panel. The first of the new blocks is the analysis report. This block summarises the output of the calculation steps and a number of validation checks that are carried out on the results.
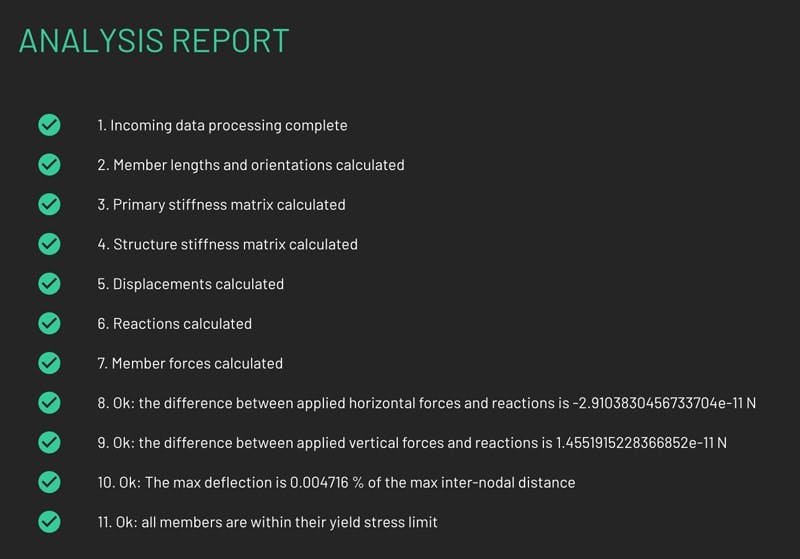
Fig 10. Analysis report generated by truss calculator
Pay particular attention to items numbered 8 to 11. Checks 8 and 9 check for horizontal and vertical force equilibrium and report the difference between applied forces and reactions. This number should theoretically be zero, although it will actually be a very small number due to the way small numbers are handled within programming languages.
Check 10 calculates the maximum nodal deflection as a proportion of the largest inter-nodal distance in the structure. This gives an indication as to whether or not the calculated deflections are unreasonably large. Very large deflections, in comparison to the scale of the structure, suggest the structure and/or loading merit further investigation. You must use your own engineering judgement to assess the acceptability of deflections. The toolbox will issue a warning if the deflection exceeds 10% of the maximum inter-nodal distance, but this limit is itself arbitrary.
Check 11 indicates if any members have exceeded their specified yield stress. In order for the truss calculator results to be valid, all members must remain within their elastic range. Otherwise, material non-linearity will lead to the calculator results being inaccurate. This is one of the easiest things to overlook in a simple truss analysis, so watch out for a red warning sign here.
Table data
Provided all indicators in the analysis report are green, we can proceed to review the three tables of data below, which show the reactions, member axial forces and nodal displacements. The tables are all filterable, sortable and searchable. Logged-in members can also download the table data to csv file. The operation of the table functions is all fairly intuitive and self-explanatory so we won’t labour each individual piece of functionality here.
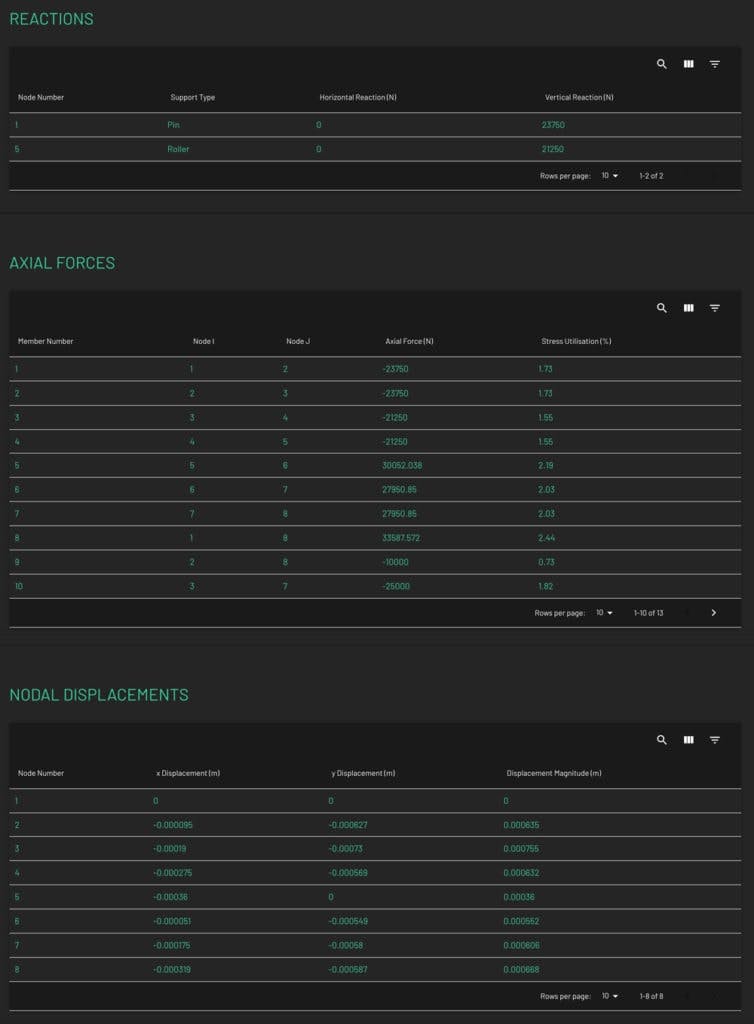
Fig 11. Tables of data output; reactions, axial forces and nodal displacements.
The sign convention was axial forces is as you might expect; compression forces are negative and tension forces are positive. Deflections to the right and upwards (positive global x and y-axis directions) are positive and the opposite directions are negative.
Reviewing results in the 3D window
The best way to get a quick sense of how the structure responds to the applied loads is by reviewing results in the 3D window. For the best overview of the 3D window and its data visualisation functionality, you should watch the getting started video at the top of this article. Alternatively, just play around with the control panel on the right. You will get the hang of what each toggle and widget does pretty quickly. I’ll briefly outline the functionality here.
Axial forces and reactions
Axial forces can be viewed with a colourmap applied to the structure. Two modes are available; ‘Binary’, which indicates tension and compression members by colouring them solid blue and red respectively and ‘Continuous’ which applies a continuous colourmap that transitions from solid blue (max tension), through white (zero force) to solid red (max compression). The colourmap corresponds to the colour bar scale that runs horizontally below the 3D view. You can also view force labels showing the magnitude of force, directly on top of each member, Fig 12. All of the options that control the visualisation are accessed in the ‘Axial_Forces’ section of the control panel on the right.
The support reactions can be toggled on and off. Toggling the reactions on will replace the supports with reaction force arrows indicating the direction of the reaction forces. The magnitude is indicated with an annotation.
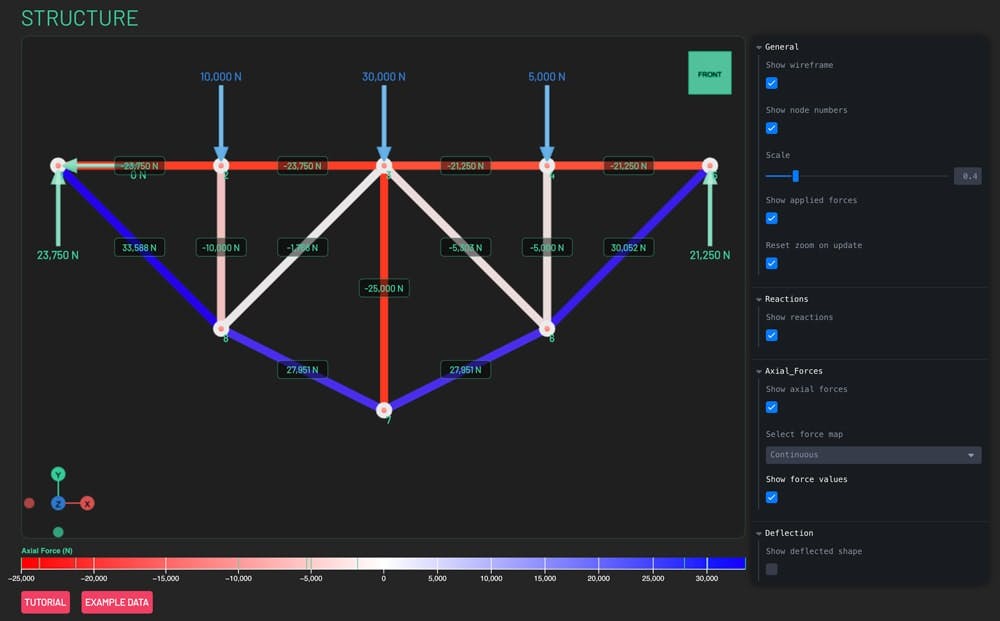
Fig 12. Axial forces indicated with colourmap and annotations and reaction forces shown with force arrows and annotations.
Deflection and nodal displacements
The deflected shape of the structure can be toggled on and off. This can also be scaled using the slider in the ‘Deflection’ section of the control panel. This makes small deflections easier to visualise. Exaggerating the deflection can also help to clarify qualitatively how the structure responds to loading. Labels can be toggled on and off showing the x and y displacements for each node.
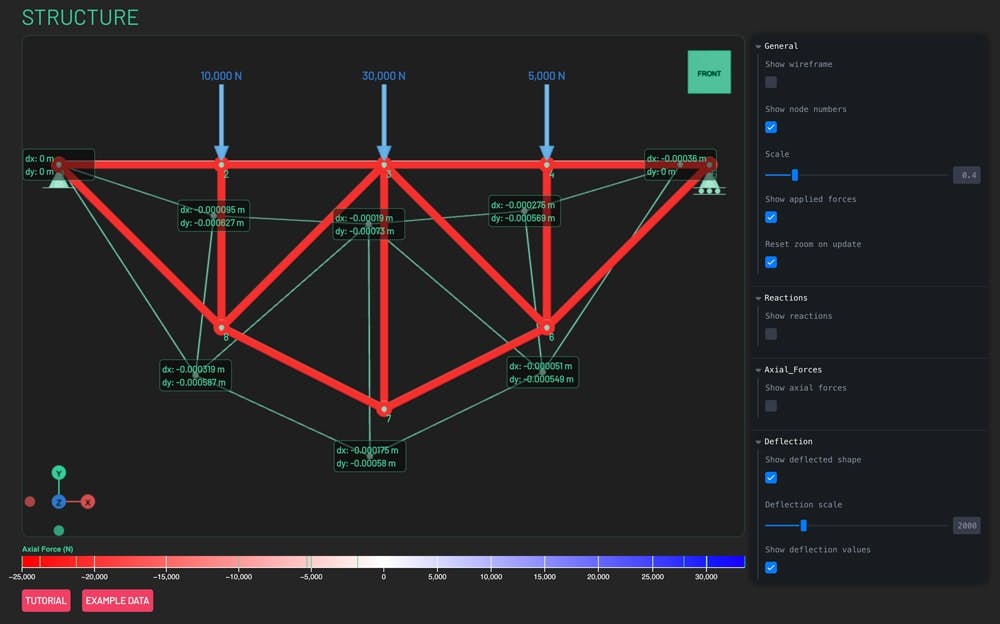
Fig 13. Scaled deflected shape with annotations indicating nodal displacements.
General 3D view operation
In addition to the data visualisation options summarised above, there is some general 3D view functionality worth briefly summarising. Although we’ve only viewed the structure from a front orthographic view (most suitable for a 2D truss), this view is fully 3D, so you can pan and rotate around the structure using your left mouse button (click and hold) to rotate and right mouse button to pan. The scroll wheel allows you to zoom in and out. Clicking on one of the 3D view gizmos in the top right or bottom left of the window will allow you to easily return to a set orthographic view.
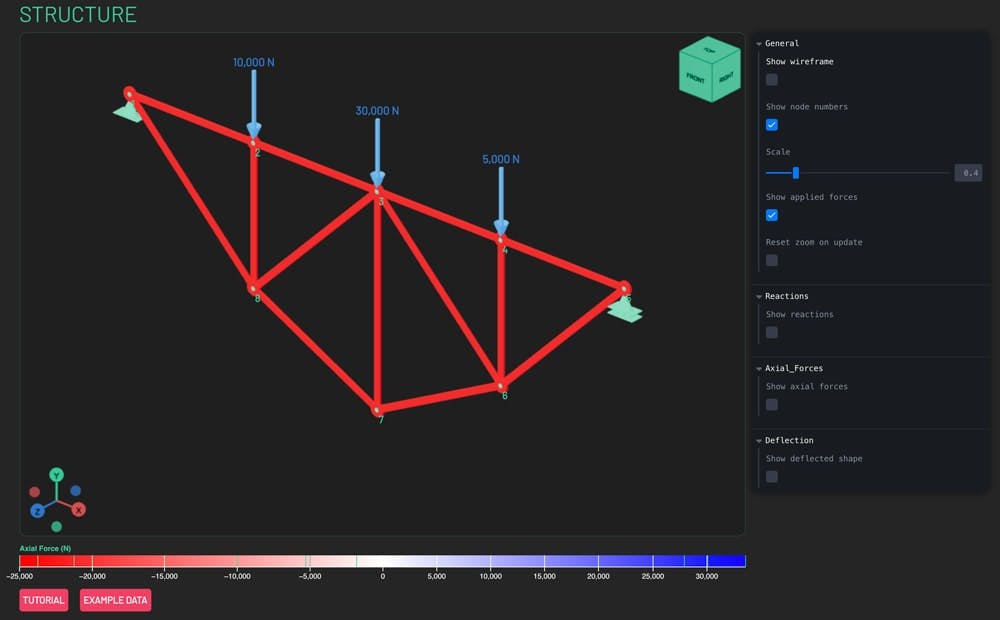
Fig 14. Rotated view of the structure.
A wireframe view of the structure can be toggled on or off. This is particularly helpful when evaluating the deflected shape of the structure. You can also toggle node numbers on and off.
The final option is the ‘Reset zoom on update’ toggle. When toggled on, the zoom level of the 3D view will be reset after each option panel change. The zoom level is updated to maximise the size of the structure within the viewport. If you don’t want the zoom level to update when you change something in the options panel just toggle this off. This is helpful when you have zoomed in to investigate an area of the structure and don’t want to lose your zoom level when you change a visualisation option in the control panel.
Wrapping up and Guest versus Member users
That’s all there is to it. After 5 minutes of playing around with the free truss calculator, you’ll have the hang of it. Hopefully, you’ll find it a helpful resource. Students, in particular, should find it helpful as a quick and easy tool to test manual solutions against.
This is a free truss calculator, however, there are some limits on the size of structure that can be analysed without logging in as a member. These limits might change (or be removed) but at the time of writing, guest users are limited to structures with no more than 25 members and 3 restrained degrees of freedom. This means students shouldn’t run into any trouble analysing statically determinate structures that would be reasonably analysed by hand.
If you want to analyse larger structures, you’ll need to become an All Access Member to have unlimited access to the truss calculator toolbox. You’ll also have unlimited access to all future toolboxes (3D space frame toolbox coming next), all DegreeTutors courses and the other other benefits of membership detailed on the membership page.
That’s all for this one, see you in the next one.
Dr Seán Carroll's latest courses.


Featured Tutorials and Guides
If you found this tutorial helpful, you might enjoy some of these other tutorials.

A Python Programming Roadmap for Structural Engineers
Your complete learning resource guide to getting up and running with Python as a Civil or Structural Engineer.

Dr Seán Carroll

Steel Column Design using Eurocode 3 - A Complete Guide
Learn how to design steel columns subject to compression and biaxial bending.

Callum Wilson
Truss Analysis using the Direct Stiffness Method
A complete introduction to the Direct Stiffness Method for truss analysis with a detailed numerical example
Dr Seán Carroll