Getting Started with Graphic Statics
![[object Object]](/_next/image?url=%2Fimages%2Fauthors%2Fedmond_saliklis.jpg&w=256&q=75)
Hello and welcome to an exciting journey into the world of graphical structural analysis or graphic statics. New ideas will open up before your eyes with this tutorial, and although the initial diagrams may appear overly complicated, you will soon see that they are not only simple to construct, but they contain an incredible secret!
Herein, I want to give you an introduction to what graphic statics is and to explain why I'm so passionate about it. I intend to utterly change your perception of structural form and structural forces!
You will become a convert, like I became, once I saw the beauty and the power of this technique.
1.0 A brief history of graphic statics
The heyday of graphic statics was really in the 1920s and the 1930s. A great starting point, it you're new to the subject is the fantastic book, Graphical Analysis by William S. Wolfe - written in 1921.
Fig. 1. Graphical Analysis by William S. Wolfe (1921).
By 1934, there were papers published in the Journal of American Society of Civil Engineers, for example "Stresses in spatial structures" on 3 dimensional graphic statics.
Fig. 2. Stresses in Spatial Structures (1934).
However, the study of graphic statics goes back further in history. A key figure was Pierre Varignon, who, in the eighteenth century, started writing about the topic and publishing beautiful drawings.
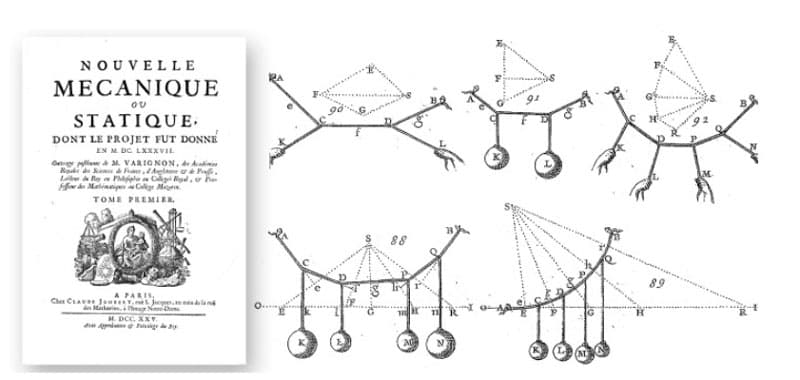
Fig 3. Nouvelle Mecanique ou Statique by Pierre Varignon with depictions of funicular forms.
The loaded cable/rope shapes depicted by Varignon (Fig 3 above) are very intuitive and simply feel "correct" to us. The reason they "feel" correct is because we see these again and again in real life, these shapes are called funiculars.
The word funicular refers to the shape that a hanging chain would take under any load. A specific funicular that you might have heard of is a catenary, but that is a chain subjected to only its self weight.
In these figure we see point loads. Those hands pulling on the chain are imposing point loads and since we are neglecting the weight of the chain itself, the chain forms straight lines between the points of load application.
The beautifully drawn spheres represent point loads acting downwards in the direction of gravity. Hopefully the resulting shapes are intuitively correct to you.
Even though the peak of graphic statics was in the 1920s and 1930s, by the 1960s it was essentially gone. Why it disappeared is a longer story, but the synopsis is that we academic professors fell in love with matrix methods and the very sophisticated theories of structural analysis and structural mechanics that continued to flourish mathematically.
Then, the somewhat brutish theory of matrix methods found widespread applications through the availability of the computer, in the 1960s 1970s and 1980s. That really drove graphic statics down essentially to the grave, coupled with the fact that engineers drew less and less by hand.
But then something miraculous happened. Ed Allen and Vaclav Zalewski were the people that promoted the rebirth of graphic statics. Together, they wrote two books. The first was "Shaping Structures", and the second was "Form and Forces". This second one is a great book. It affected a lot of people, who took the topic much, much further than Allen and Zalewski did.
Fig 4. Form and Forces: Designing Efficient Expressive Structures by Allen Zalewski.
However, that book is not a book to learn graphic statics. It's a great book to see how to use graphic statics, but to actually learn how to do graphic statics I would recommend my recently published book, Structures: A Geometric Approach.
Fig 5. Structures: A Geometric Approach by Edmond Saliklis.
Let's also mention some of my heroes in the world of graphic statics. Professor John Ochsendorf was a mentee of Ed Allen, and he was deeply affected by Ed Allen's pedagogy. Ochsendorf then mentored Phillipe Block who is a brilliant engineer at ETH Zurich, one of the leading masters of geometric methods. Block's PhD student, Masoud Akbarzadeh, who is now at Penn does amazing 3 dimensional graphic statics.

Fig 6. John Ochsendorf (left), Phillipe Block (center), Masoud Akbarzadeh (right).
In this tutorial, we are not going to do any 3 dimensional graphic static. We're just going to stay within a limited palette to understand the material. At first, we are not even going to use the computer. Even if you're a Rhino/Grasshopper guru, please simply use a pencil and paper - in this first tutorial I want you to really understand how to do this with the pencil.
2.0 External loads, funiculars and reactions for a two-dimensional truss
Why start a Graphic Statics lesson with a 2D truss? A truss is a great starting point for at least three reasons.
- The first is that we can look at the external forces of a truss and graphically find the external reactions.
We need those reactions first, in order to find the member forces within the truss itself. Don’t get turned off by the slightly long format way of getting external reactions. You will soon see that this brings us back immediately to the extremely important funicular, introduced above.
-
The second reason is that nobody likes method of joints. It is tedious and prone to errors.
-
The third reason is the best however! We see that the form of the truss is inextricably linked to the forces in the truss. They're tied together. In fact, they are reciprocals of each other.
This idea is super powerful, because it allows you to redesign your truss based on forces and immediately see how the forces interplay with the form.
You could do it all with sliders on the computer which admittedly is much faster (we'll explore this in a future tutorial) but today you will do this by hand. So, let's get started.
Put down 5 points, with a hand sketch, no need for a ruler, just get it roughly to the same proportions as shown below.
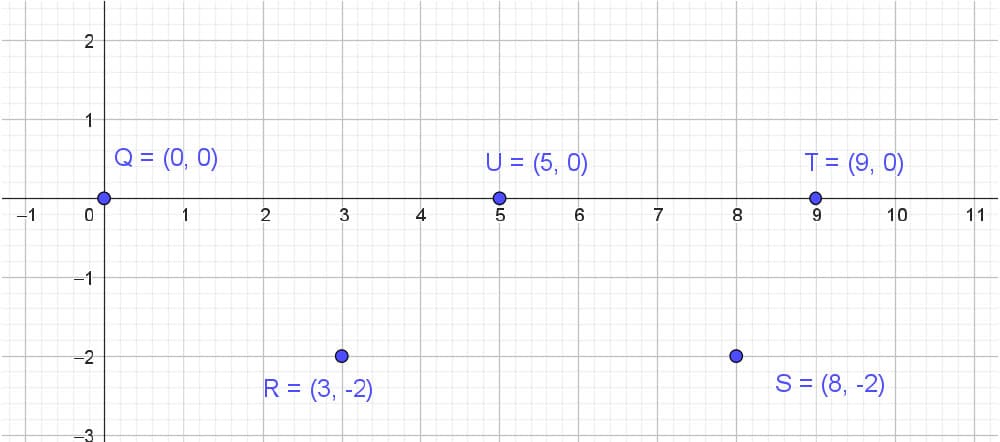
Fig 7. Five points, Q, R, S, T, U.
We’ve specified the following:
Q = (0,0)
R = (3,-2)
S = (8,-2)
T = (9,0)
U = (5,0)
Please note that point U is not quite at the middle, it is at (5, 0). Next draw the elements of the truss - don't worry about the letters right now.
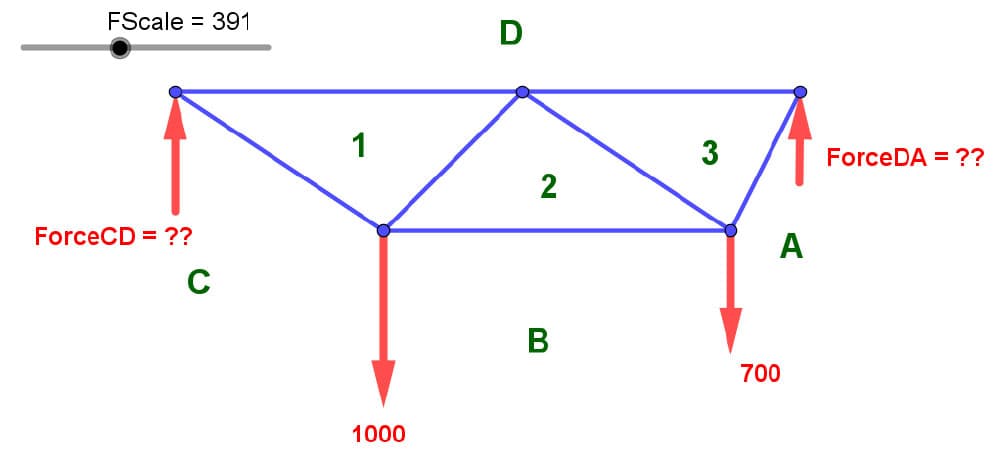
Fig 8. Sample truss with 2 applied loads and two unknown reactions.
Here, it was drawn to a specific scale. On paper, we always draw it to some scale because of the size of your paper. So you're already choosing a form scale.
Next add the forces, here on the computer I used a force scale which happens to be 3.91, but you cannot do that by hand. So what I'd like you to do is put 2 external loads on the truss. One of them is 1000 units of force and the other is 700 units of force.
When drawing by hand, be sure that the 700 load is roughly 2/3 the size of the downward 1000 load. Next we have 2 supports, one on the left and one on the right. We ignore horizontal reactions here as all of our applied loads are vertical.
We don't know the magnitude of these reaction forces. We know their direction is probably upwards, because the loads are downwards. We know where they are, but we don't know their magnitudes. The scale of the left and right reaction arrows doesn't matter because we don't know the magnitude.
Now, notice that the left reaction is not labeled as R-left. It is labeled as ForceCD. This is important. As you move from Zone C to D, that's that force name. As you move to from zone D to zone A, that's another force called ForceDA. Then as we move from Zone A to Zone B we observe a downward drop. Moving from Zone B to Zone C is another downwards drop, a known drop, but moving from Zone C to Zone D is an unknown leap upwards.
Now, what am I talking about? I'm talking about a force diagram. A force diagram which must be drawn to scale roughly, if you're using a pencil, no need to use an engineering scale here. Simply draw it roughly to scale.
2.1 Force diagrams and funiculars
Let’s take a brief detour to examine force diagrams in a little more detail. Consider an example of a truss with normal loads, such as wind pushing on the top left chord of the truss, and then downward loads, which might signify gravity. This is an example from my book.
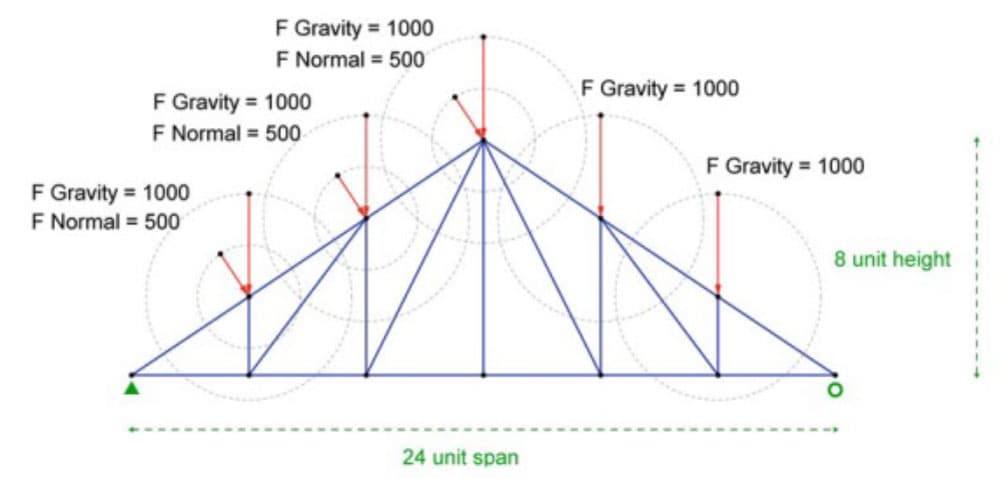
Fig 9. Extract from Structures: A Geometric Approach showing a truss subject to a range of loading.
We apply Bow’s notation (from the nineteenth century) to label the form diagram with capital letters while the corresponding lower case letters are used on the force diagram to the right (below). Bow wrote a book about graphic statics, and that notation is still used today.
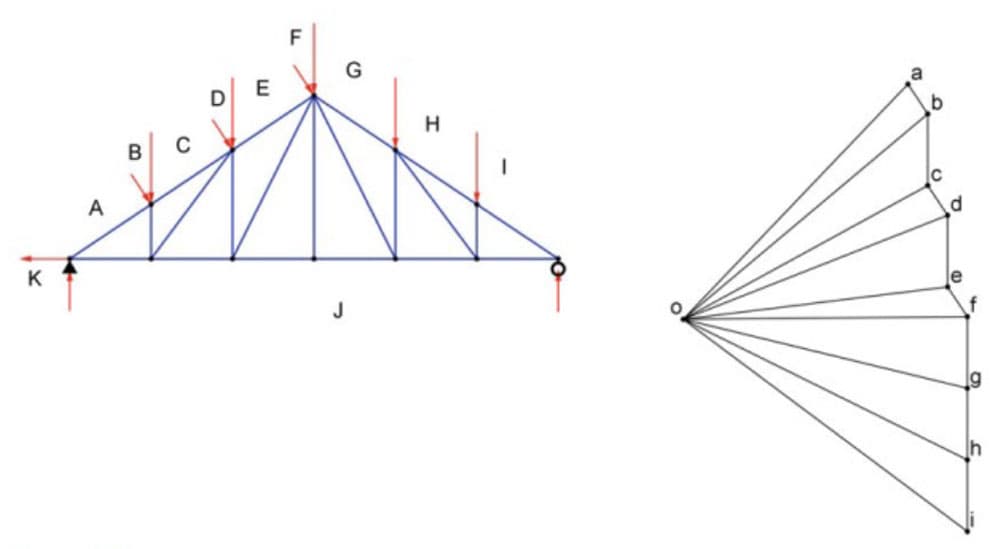
Fig 10. Extract from Structures: A Geometric Approach showing the form and force diagrams.
Notice that to construct the force diagram, we simply add all of the force vectors - something that you intuitively know how to do. Vectors are added by putting the tail of the subsequent vector at the tip of the previous vector so tip to tail or tail to tip, you just line them up.
Notice that the first externally applied force is actually known, it is 500. But it will not be labeled as 500, it will be referred to as Force AB.
In the force diagram it must be represented as parallel to that 500 shown on the form diagram.
The next applied force is 1000 downward. Thus, in the force diagram we drop down 1000. So, going from B to C we drop 1000, shown to scale. Then from C to D is a force of 500, but inclined. Thus, we draw these lines parallel to the 500 on the force diagram. We repeat this process for all of the forces shown on the form diagram.
Next, we will create the funiculars (that hanging chain that we saw earlier) and use it to get the reactions.
Now, of course, I know that you can get those reactions using algebraic statics. But I'd like you to do it using graphic statics. Please don't think this is tedious, it will pay off many times later as we use the funicular for many operations.
The creation of the funicular is shown in the figure (extract) below. Note the orange "closing line" which will be defined shortly.
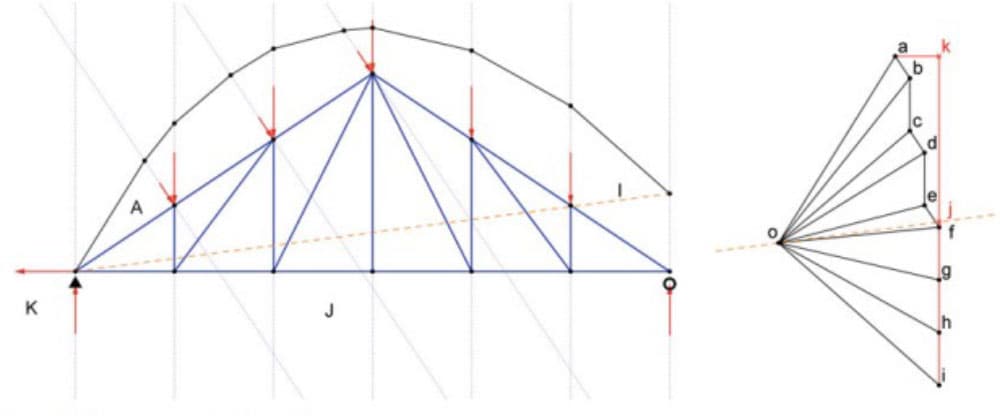
Fig 11. Extract from Structures: A Geometric Approach showing the construction of the funicular.
-
The funicular is constructing by first selecting an arbitrary pole location on the force diagram, in this case, identified as position O.
-
Each point on the force vector diagram is connected back to the pole to form ray lines.
-
The segments of the funicular are then obtained by intersecting lines with the same slope as the rays with the lines of action of the applied forces, as shown above.
The closing line of the funicular (dashed orange line above) can be used to determine the support reactions. The right reaction is the length of the segment while the left vertical reaction is the length of the segment . The horizontal reaction at K is the length of segment .
Let’s now take what we’ve learned and apply it to our truss example - this will also help us unpack the meaning behind the funicular a little more! If you construct a force diagram in the same manner as demonstrated above, you should now have a picture like this on your hand drawing.
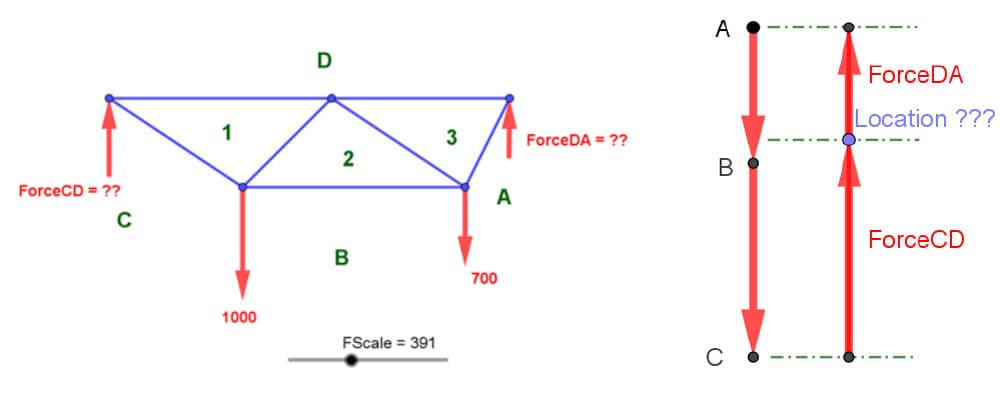
Fig 12. Form diagram (left), force diagram (right).
Draw your force diagram somewhere on the page, it could be anywhere on the page. It doesn't matter where. There will be two drops representing the external loads. That magnitude of the first drop is the first load, AB, i.e. 700. The next one is BC i.e. 1000. Here I used uppercase letters. A to B was 700 and B to C was 1000. We know that CD is going to shoot up. But we do not yet know where this blue dot is. And we know that the next arrow will jump back up to A.
How do we find that blue dot? We draw the funicular, and this is where it gets really magical.
We need to draw a pole and a poll. It is somewhat simple and kind of mysterious simultaneously. Put a dot down somewhere to the left of your force diagram, and call that dot Pole.
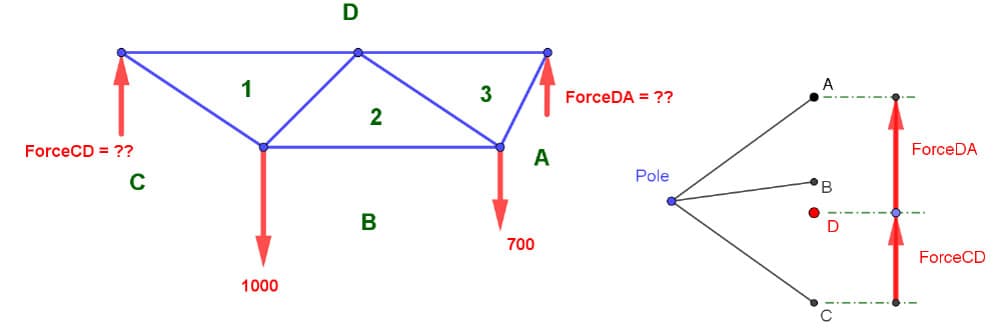
Fig 13. Form diagram (left), force diagram showing arbitrarily located pole (right).
Next, draw a segment from A to your Pole, from B to your Pole and from C to your Pole. These rays of this force diagram are magic, why? Because of the Pole!
The use of a Pole is really a double integration, and I'm using that term as an engineer because I'm not a mathematician. The change in load for an engineer is the shear, and the change in shear for an engineer is the bending moment. Now these rays are the slopes of the bending moment diagram!
I can prove that to you here by putting this diagram right on the structure itself.
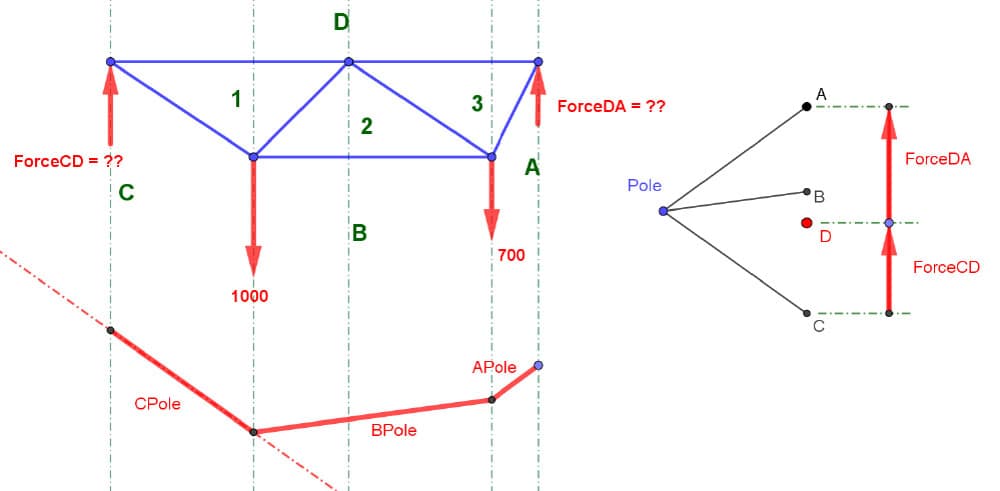
Fig 14. Form diagram (top left), force diagram showing arbitrarily located pole (top right) and ray lines mimicking the bending moment diagram (bottom).
In Europe, we like to have the bending moment diagram on the tension side. You could put it on the compression side - it doesn't matter. That is the bending moment diagram, and you can see physically that the slopes of the funicular literally create the bending moment diagram to any scale you want. There's an infinite number of funiculars. It just depends on how long your chain is. You could have any length of chain you want.
I suggest that you not draw this funicular (bending moment) diagram right on the structure as we do with bending moment diagrams, because I think it gets a little cluttered. I would like you to just put it somewhere under A
Also, please note that in my book, I almost always went from A to B as moving from left to right, however in this tutorial, the path from A to B is right to left, just to keep you nimble!
By hand, draw your 3 rays. And now transfer those rays over to the form diagram area in your physical notebook, but start under that right reaction anywhere you want on the vertical axis.
Take the first ray (from A to Pole) and pass it through that arbitrarily placed point directly under the right reaction (see Fig 15 below). No need for rolling rulers and T-squares. Just sketch it out as best as you can, ensuring that its slope coincides with the slope of the first ray of your diagram.
Now find where it intersects the load line of the next external load, we will have a discontinuity or a kink in the funicular at that point, just like Varingnon’s "hands". This fully explains why the bending moment diagram is discontinuous.
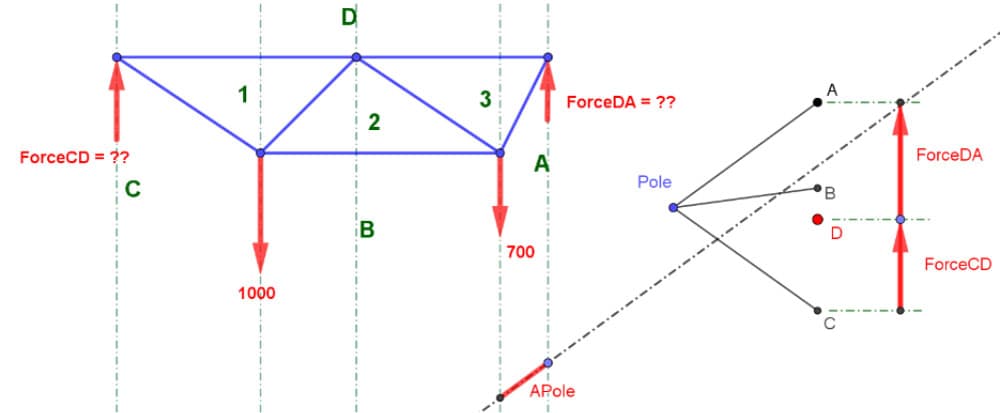
Fig 15. Form diagram (top left), force diagram (top right), first segment of the funicular (bottom).
Once that kink is located, the technique is repeated using the B to Pole ray of the force diagram, which is transferred over to the form diagram, slowly growing the funicular.
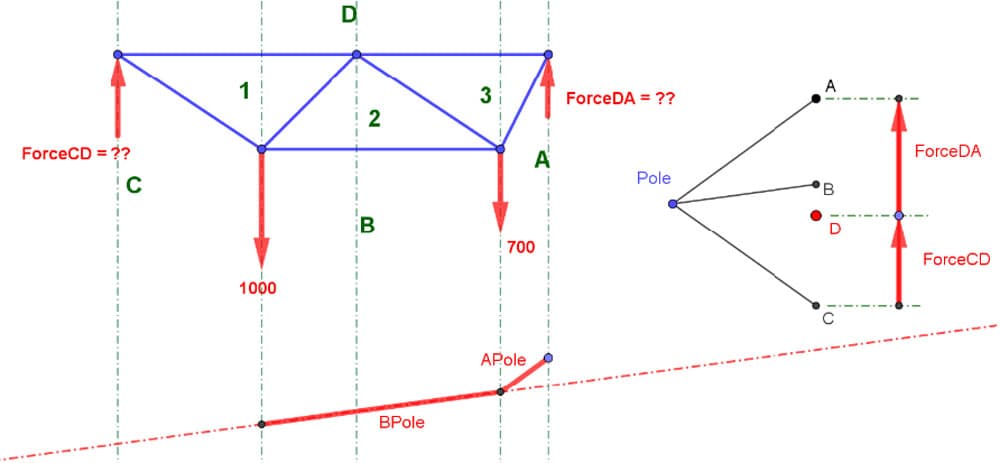
Fig 16. Form diagram (top left), force diagram (top right), first and second segment of the funicular (bottom).
Finally, we place our last segment using the same technique.
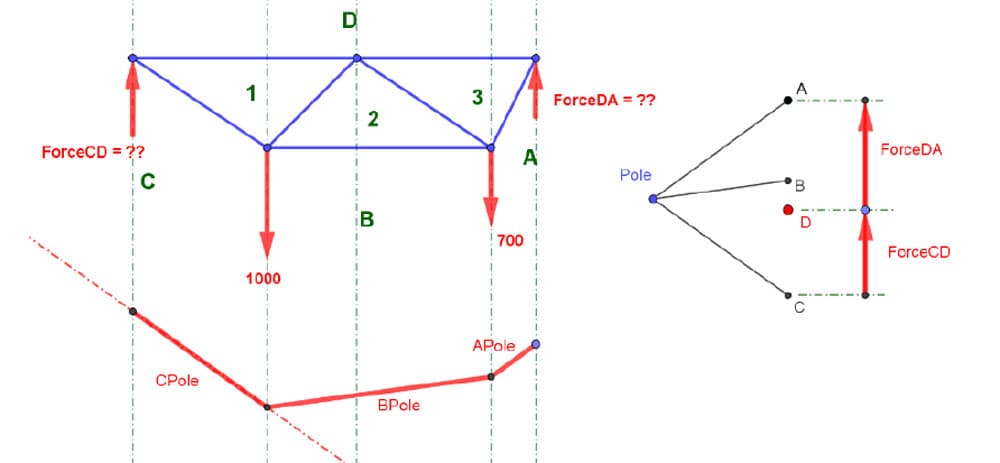
Fig 17. Form diagram (top left), force diagram (top right), complete funicular (bottom).
So that's the bending moment diagram, but recall that the reason we are doing all of this is to establish where D is. That's really the Golden Nugget that we're seeking here. Where is Letter D on that force diagram?
2.2 Finding the reactions graphically
Draw a line from the starting point to the ending point on your funicular. This is known as the “closing line”.
-
Pass a line parallel to your closing line through your arbitrary pole.
-
Establish where that slope intersects the load line and Boom! That is Point D!
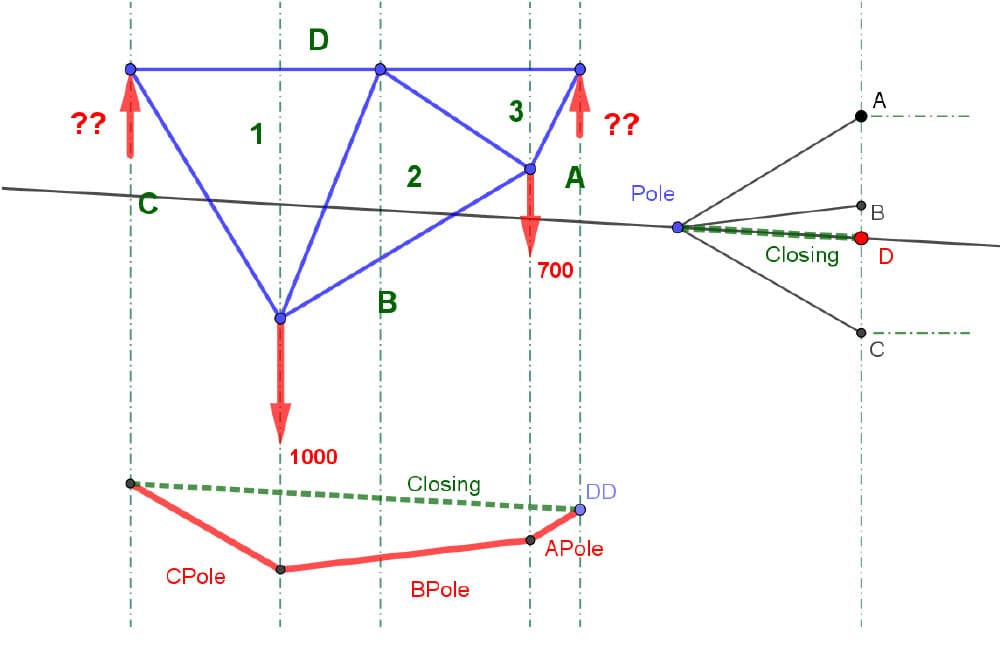
Fig 18. Identification of point D using the funicular closing line and pole.
Why is that super important? Because now we know what Force CD is. We know exactly what it is. It's the distance from C to D on the force diagram, multiplied by your scale factor, which was simply estimated in your hand drawing.
If you used an engineering scale (which I suggest that you not do!), you know precisely what Force DA. For me, going from C to D, I get 744 units of force.
One immediately sees that the jump from D back to A is bigger than 744. It's almost a thousand. But it's not quite a thousand. So hopefully, that looks correct on your diagram.
Measure the distance from D to A and multiply by your force scale (roughly!). I found that Force DA was 955, and we could check that algebraically.
A beautiful aspect of this technique is that regardless of where the poll is, we always get the same answer.
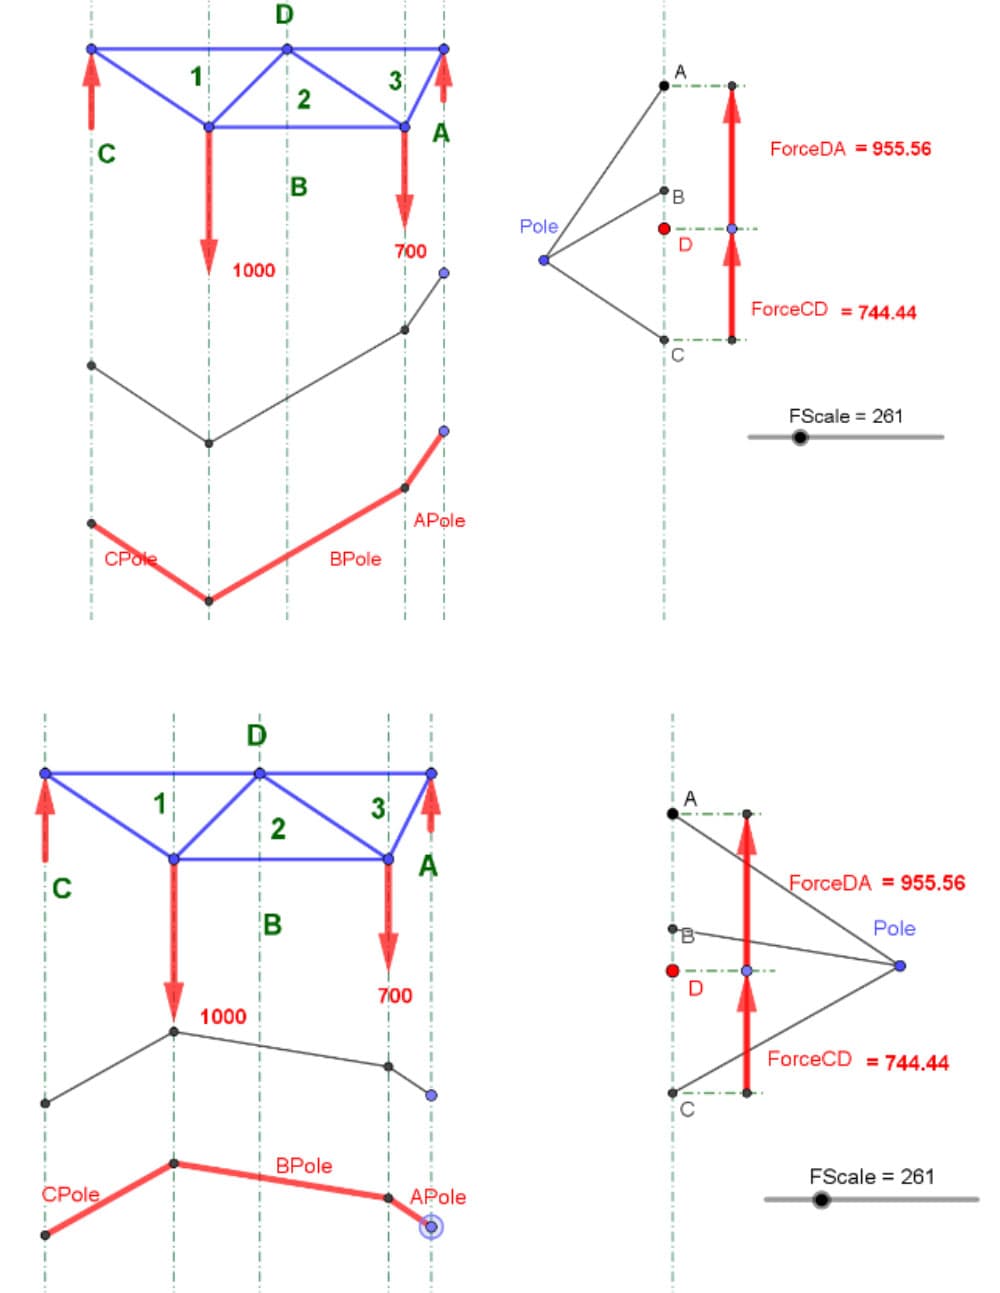
Fig 19. Identification of point D using an alternative pole location, example 1 (top) and example 2 (bottom).
3.0 Internal bar forces for a two-dimensional truss
The key objective in the previous section was to locate Point D graphically. Now let's get those bar forces. But before we get the bar forces, let's name them. What would you call the diagonal force in the bar separating areas 1 and 2 in the image below?
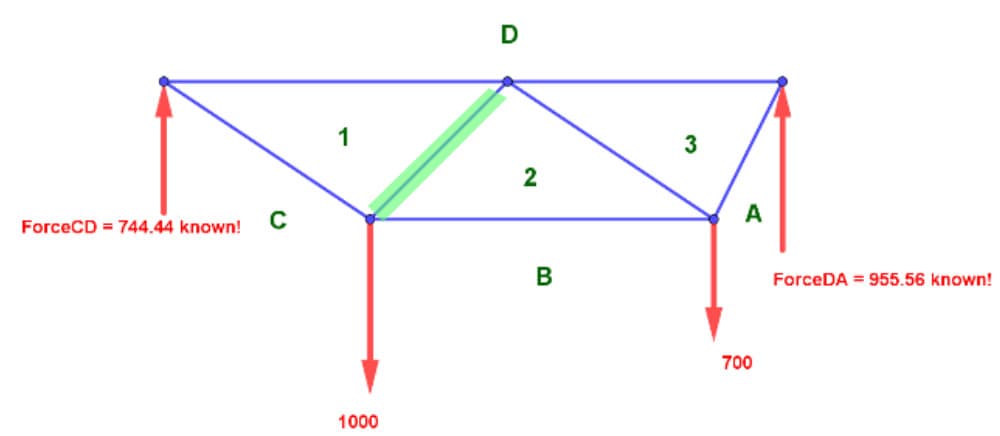
Fig 20. Form diagram with known reaction forces.
You could call it Force12…or you could call it Force21, depending on the your direction, which we will discuss in an upcoming tutorial. The other diagonal bar force could be called Force23, or Force 32. The top chord on the left is ForceD1 or Force 1D, again, depending on which direction you're going.
We always use 2 indices to identify any force. But Bow’s Notation calls for numbers, not letters, on interior areas. We use capital letters on the exterior and we use numbers on the interior, and it doesn't matter at all what you call the numbers. I just numbered them 1, 2, 3, going from left to right, even though my letters are going from right to left.
Now, which force do we find first? It is just like the method of joints in that we cannot have too many unknowns. We start by limiting our unknowns. So we can start either at the left edge or the right edge.
Let’s find ForceD1. We know that ForceD1 is common to D with a horizontal member. Notice what I said. 1 is “common to” area D, or space D with a horizontal member. And 1 is “common to” or “linked to” space C with a diagonal number. So, place a line that is horizontal through D, and place a line that is sloped through C, and where those 2 lines intersect is, in fact, point 1.
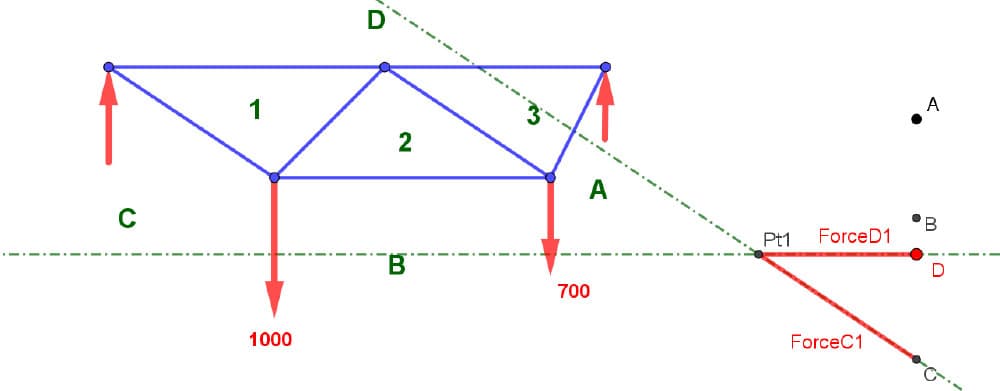
Fig 21. Identification of point 1.
Next, let's find point 2. What is point 2 common with? 2 is common to 1 through a sloped line. It is also common to 3, but we don't have 3 yet. It is not common to D through a single number. We can't get from 2 to D with a single number - that's impossible.
But I can get from 2 to B with a single number. Thus, 2 is common to B through a horizontal line. And where they intersect, boom! That's point 2.
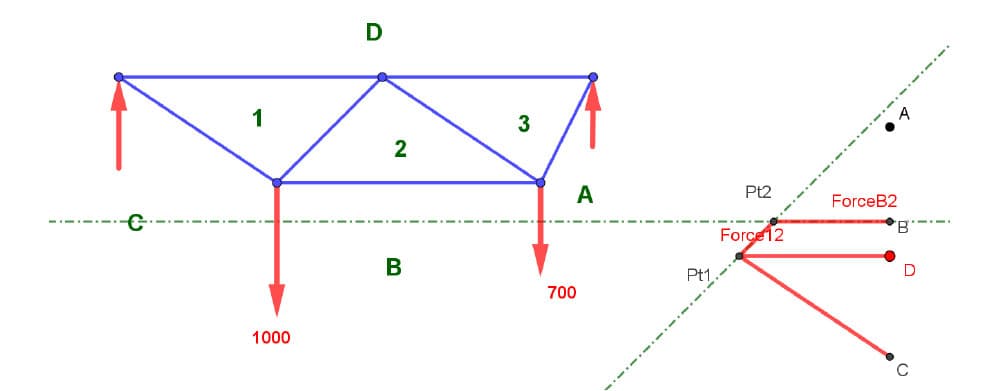
Fig 22. Identification of point 2.
Finally, we have to find point 3 - in doing so, something wonderful is going to happen! We notice that 3 is common to D, 3 is common to A, and 3 is common to 2. Yet 3 is not common to B at all.
So I have 3 conditions, which is exactly like the method of joints where you always have that extra equation. Remember that you always get that extra equation at the end, and it feels so good when it works.
And yet, it hardly ever works first time! We often must go back and redo everything. But this extra check will indeed work out with graphic statics.
So, 3 is common to D through a horizontal line, 3 is common to A through a diagonal line. And as a check, 3 is common to 2 through another diagonal line!
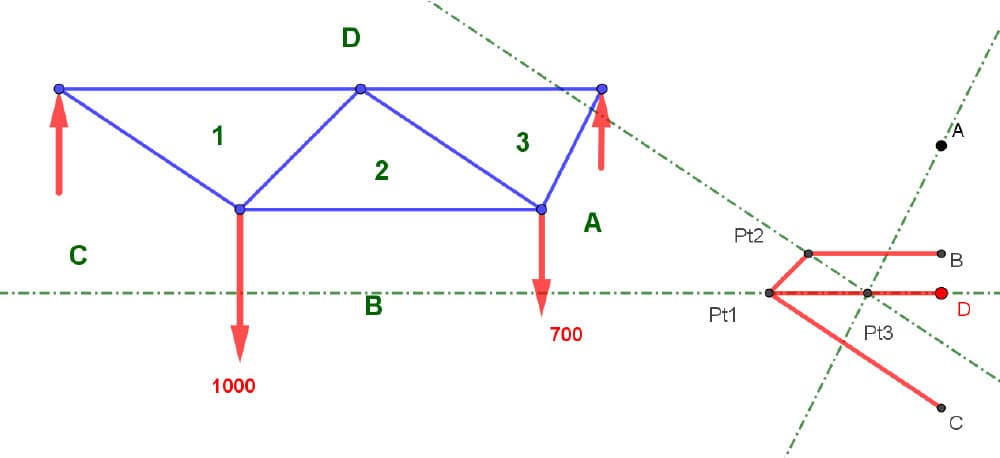
Fig 23. Identification of point 3.
I admit that the first time you see it, it looks really confusing. However, like anything else in life, after you've done it a couple of times it's not confusing at all.
Now we're done! For example, the magnitude of Force23 is the length of the segment from 2 to 3, multiplied by the force scale. That is, the force in that bar 23.
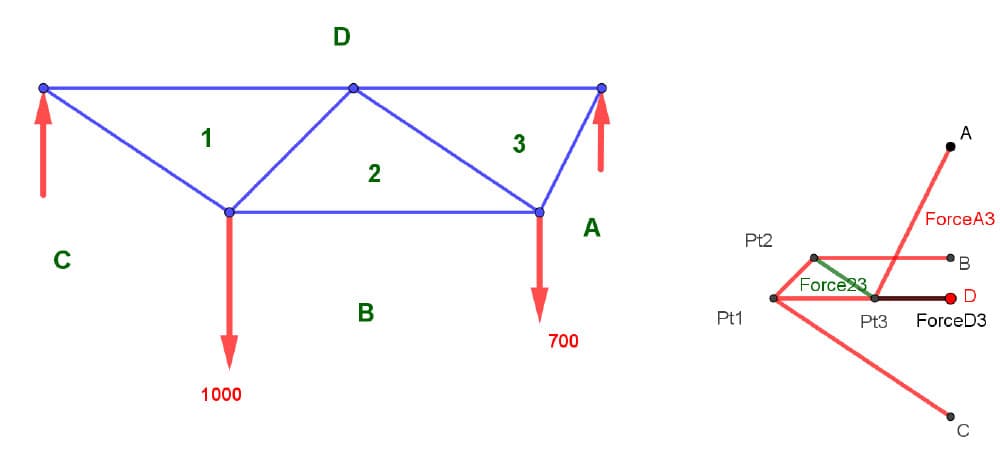
Fig 24. Identification of the Force23 in bar 23.
All of the bar forces are known! For example, the force in Bar D3 is the length of the segment between D and 3, multiplied by the force scale.
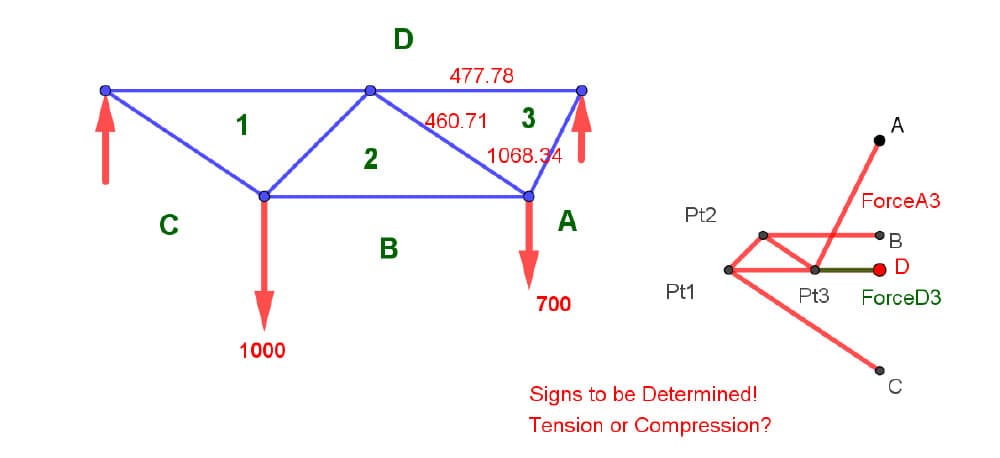
Fig 25. Identification of the ForceD3 in bar D3.
4.0 Redesigning a two-dimensional truss using graphical statics
We notice that some of the segments of our final truss force diagram are much larger than other segments. This is where we can start to redesign the form, based on the forces. Clearly, we know that reducing the forces by making the truss deeper is a good strategy. But how much deeper? We do not want to use trial and error. We could actually adjust the drawings since they are inextricably linked to each other.
How can we use this form and force reciprocity? And how does the bending moment diagram come into truss analysis? One might say, “Oh, yes, we know that the truss acts essentially globally, like a beam, even though the individual pieces of the truss don't bend because they are loaded only at the nodes.” Yes, but that's not what I'm referring to. I'm referring to the bending moment diagram of your truss.
So what I'm suggesting is the following - does our truss look like our funicular? Yes or no?
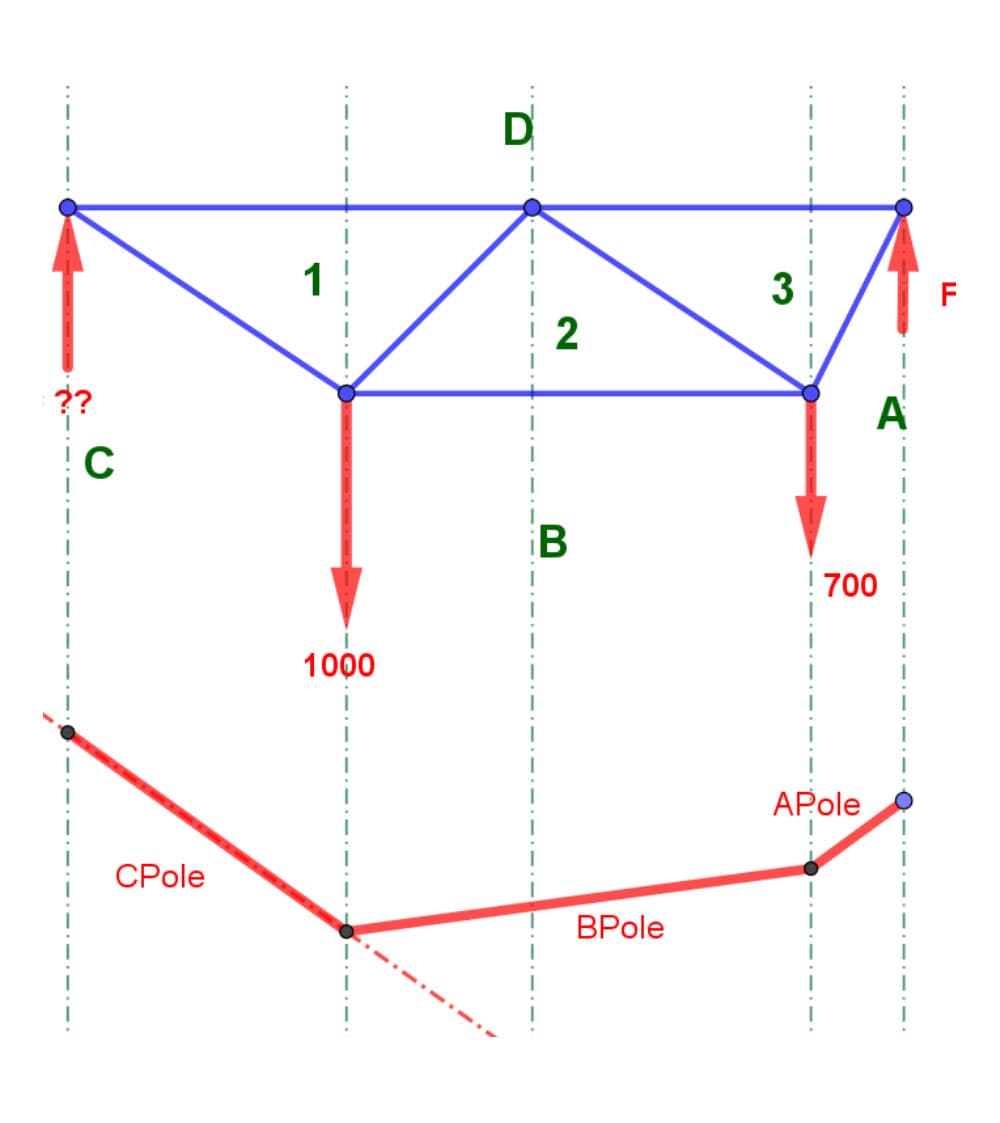
Fig 26. Truss form diagram (top) and funicular (bottom).
The answer is no. However, what if I knew the ratio of the heights of my bending moment diagram, my funicular height at Point R? And the height at Point S?
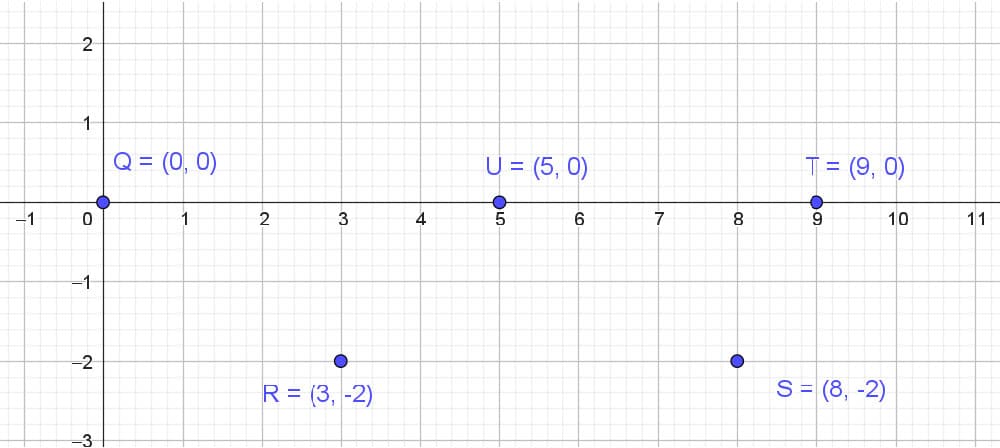
Fig 27. Truss nodal points.
It doesn't matter what the scale of your funicular is. The relationship between the heights of the funicular at various points is the important thing.
How much larger is the height at R compared to the height at S? Why not reflect that in my structure? Why not have my structure be structurally rational? So rational that the unwashed masses walking past my structure might say, “Look! The depth of that truss sure looks like a funicular to me.”
That's what I want you to say after you see this. And that's what I want people to say when they see your structures that look structurally rational. “To me, it looks like a funicular!”
And we can do that, we can change the heights of our truss depth. Here I didn't make it exactly the same.
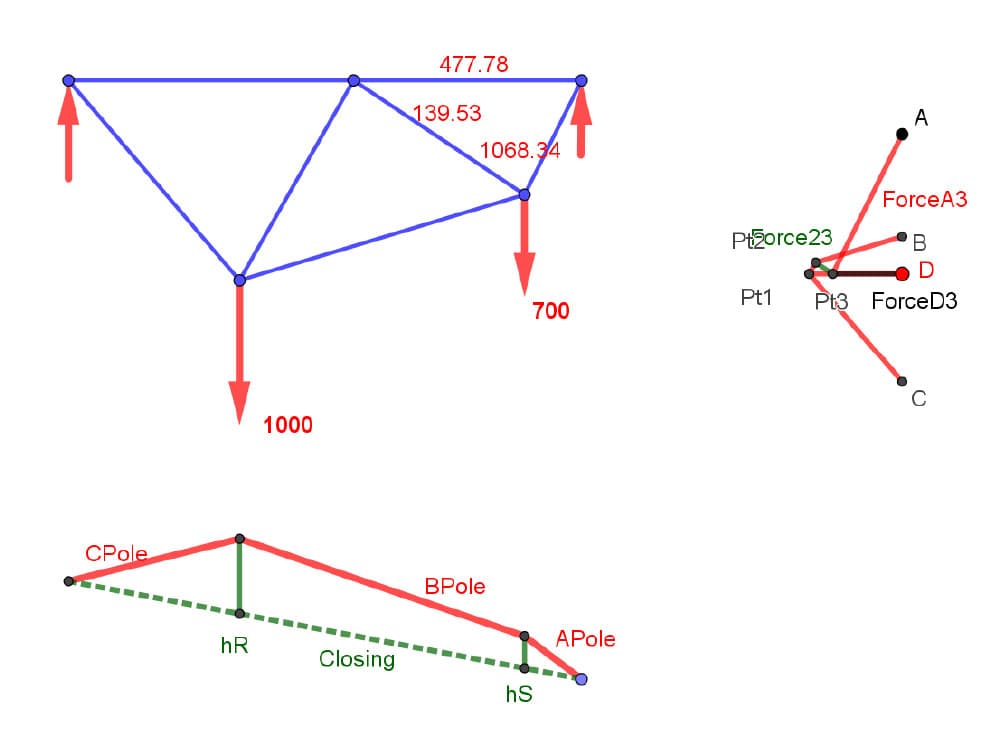
Fig 28. Truss rearranged to approximately match the proportions of the funicular.
I didn't make it exactly the ratio of height at R to height at S. I made it close. The reason I did it this way is that I didn't want your head to explode all at once :) But I want you to recognise what's happening to those diagonal interior members. They are becoming useless - they are becoming zero force members!
What if I can make a truss with only the top chord and the bottom chord? A truss, not a beam! Yes, of course we need those diagonals for stability and unanticipated loading. But what if I have ducting going through my structure and I really need some big openings. Or what if I just want to show off? Because I read this incredible article on graphic statics on EngineeringSkills? And I want to make a truss that has no diagonals. Can I do it? Yes, you can. You can make it such that it's exactly the shape of the funicular to any scale you want.
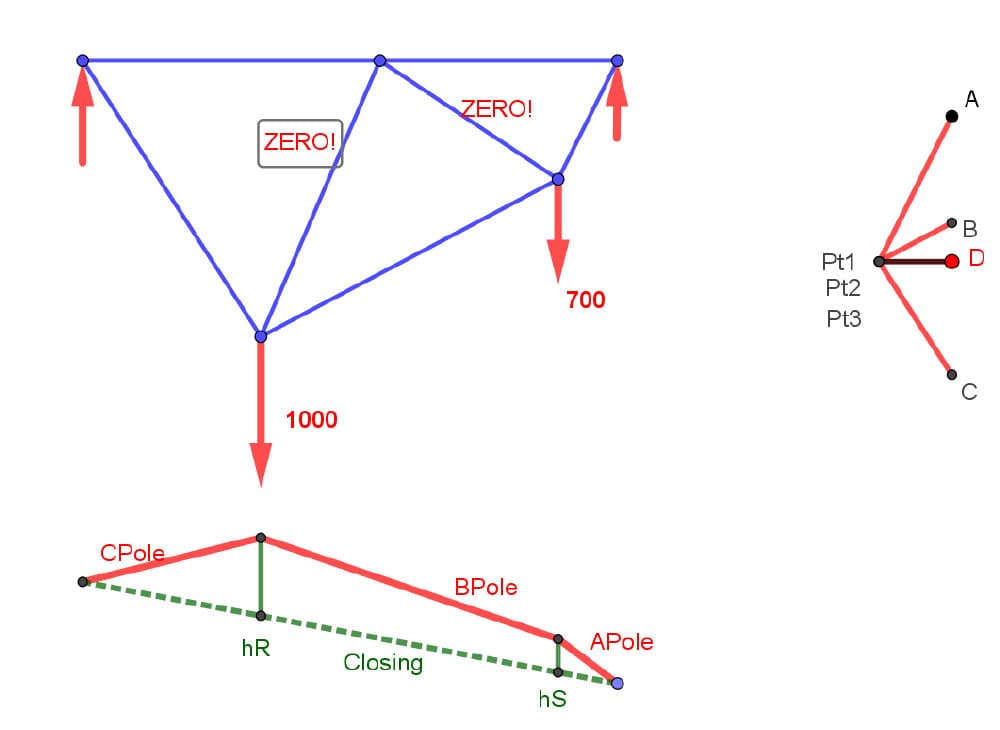
Fig 29. Truss rearranged to exactly match the proportions of the funicular with zero force internal members.
🤯 When the form of the truss coincides with (or is similar with) the funicular, those interior diagonals become zero force members!
We clearly see that Point 1, Point 2 and Point 3 all coincide on your force diagram. That's head exploding!
5.0 Graphical structural analysis - final thoughts
You've heard me say it over and over again...practice, practice, practice!
Reading through this tutorial is a great start - you should now have a pretty clear roadmap in your mind of how to approach graphical structural analysis. But the real learning comes from doing. So grab a pencil and paper and start sketching out your own trusses.
Rememeber, all you need to validate your graphic statics solutions is a quick application of the method of joints - or if you really want to crank through a lot of examples, you can use our free 2D truss calculator to check your work and confirm your graphic statics solutions.
Ok, back to Edmond...
So, let's summarise what we've covered:
- The form and the forces are drawn on the same page to convenient scales, one for the form diagram and one for the force diagram.
- We created a funicular to establish the external reactions,
- We used the funicular to determine the internal member forces
- Of course, we could have done that algebraically, but doing it graphically allowed for the opportunity to redesign the truss in an exciting way, firmly linking it all together.
In my next EngineeringSkills tutorial I show you how to do all of this in Geogebra, the children's program which promotes the learning of geometry and algebra. But for now, start picking up some of the classic books on Graphic Statics and slowly build up your library. We look forward to hearing your responses to this tutorial. Have fun and learn!

Featured Tutorials and Guides
If you found this tutorial helpful, you might enjoy some of these other tutorials.
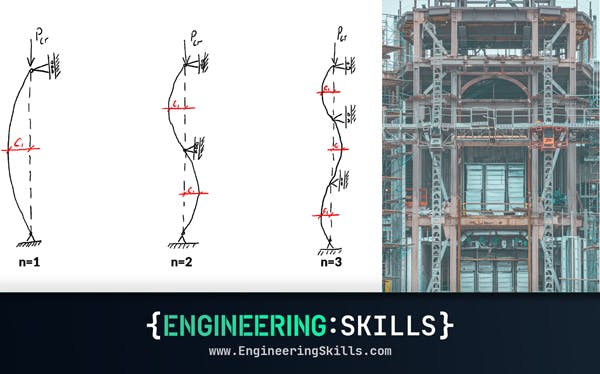
Column Buckling Equations
Determine column buckling equations for axially loaded column with different end conditions

Dr Seán Carroll
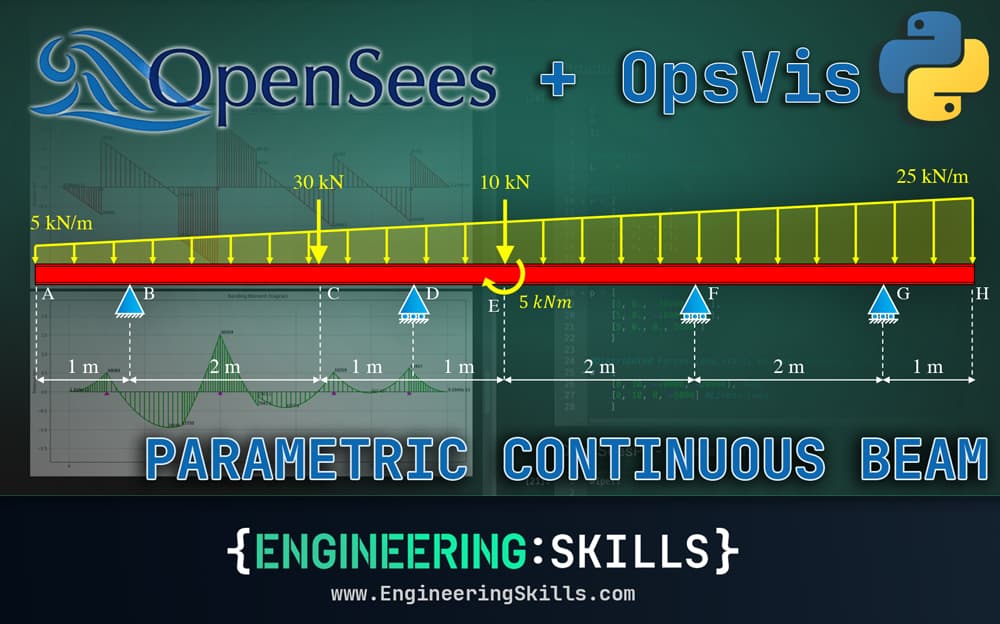
OpenSeesPy Quick Start - Build a Parametric Continuous Beam Calculator (with hinges)
Indeterminate continuous beams are everywhere, so having a fast means of analysing them is a must.
Dr Seán Carroll

Simulating crowd vibrations using the Duhamel Integral
Learn about the Duhamel Integral & how it can be used to simulate crowd-induced vibrations in Python
Dr Seán Carroll